2018 Report of the Fisheries of the United States

Each fall, NOAA Fisheries publishes the Fisheries of the United States Report for the previous year and has been doing so for over 100 years. The report provides a snapshot of statistics on recreational and commercial fisheries, landings and value throughout the United States.
Recreational fishery statistics are more difficult to quantify and value due to catch-and-release practices and the absence of sales of landings. For this purpose, data is collected via a survey program referred to as the Marine Recreational Information Program (MRIP). The MRIP program is a state-regional-federal partnership that collects important information about recreational fishing activity and impacts through estimation of catch and fishing effort.
Although only 9% of finfish landings in weight in the US can be attributed to recreational fisheries, millions of anglers participate in recreational fishing practices each year. Recreational methods account for the predominant catch of some select species such as red drum and spotted seatrout not typically  targeted by commercial fisheries, making the estimation of recreational catch and effort important to these species’ assessment and management.
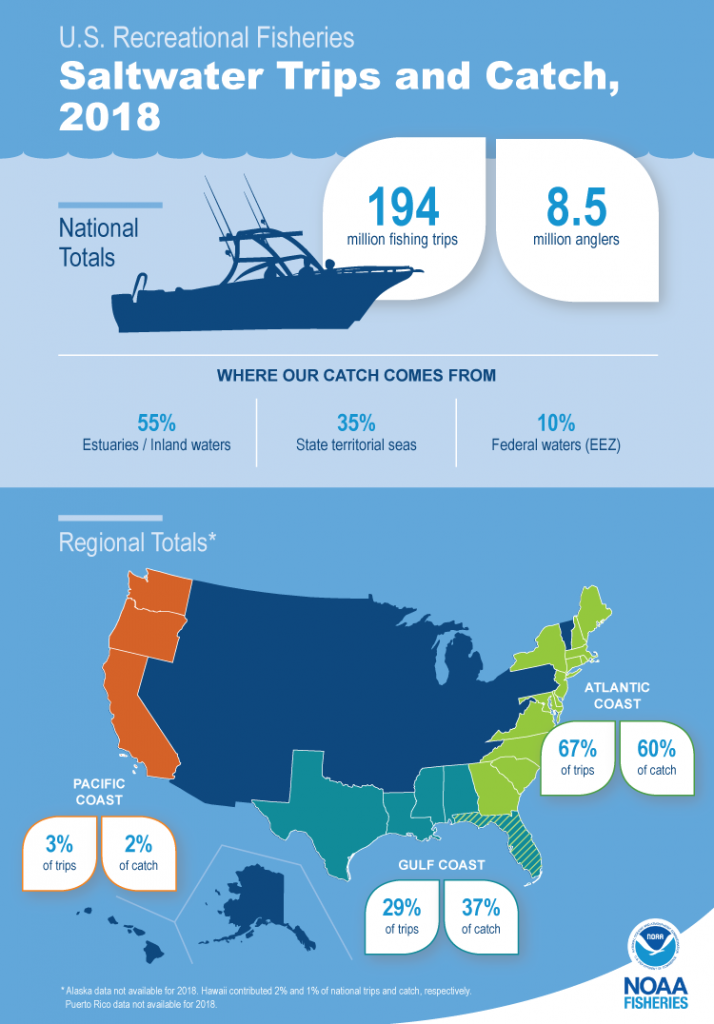
In 2018, nearly 8.5 million recreational anglers took 194 million fishing trips in the continental US and Hawaii. An estimated 956 million fish were caught and with 64% of these released alive. Of the harvested recreationally caught fish, it was estimated the total weight of landings to be 359 million pounds. A total of 55% of fish (in numbers) were caught in inland waters while 35% came from state waters and 10% came from exclusive economic zone waters indicating a vast majority of fish caught recreationally come from inland waters of the Atlantic, Gulf, and Pacific Coasts. An estimate of 60% of the catch and 67% of the trips were attributed to anglers in the Atlantic while  the Gulf Coast accounted for 37% of catch and 29% of trips. The Pacific Coast accounts for much less of the catch and trips at 2% and 3% respectively. Finally, Hawaii accounts for 1% of both catch and trips.
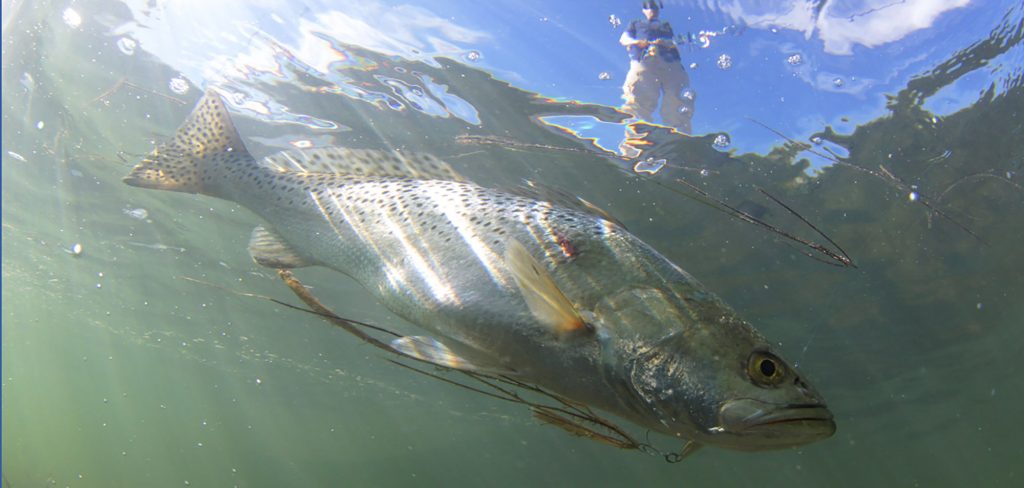
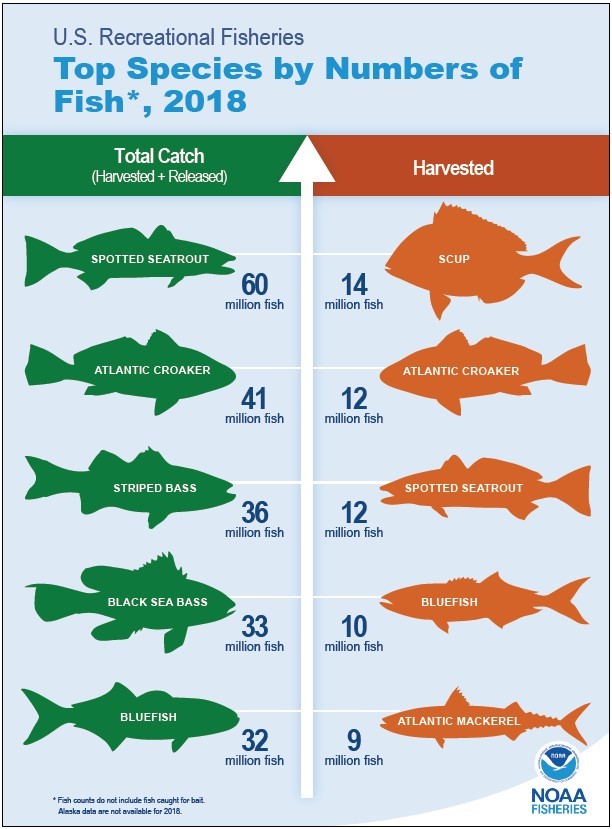
The top species caught recreationally (not including baitfish) and released or harvested is the spotted seatrout at 60 million fish followed by Atlantic croaker at 41 million and striped bass at 36 million fish (See Infographic 2). Values for recreational harvests include scup in the top spot with 14 million fish harvested followed by Atlantic croaker with 12 million fish and spotted seatrout with 12 million fish. These values (48 of 60 million spotted seatrout released) indicate the clear preference for catch and release of species through angler preference, closed seasons, and regulatory size limitations.
For more information see the full NOAA Fisheries report, download the document here: https://www.fisheries.noaa.gov/resource/document/fisheries-united-states-2018-report
